
Cost of Living in California: What It Really Costs
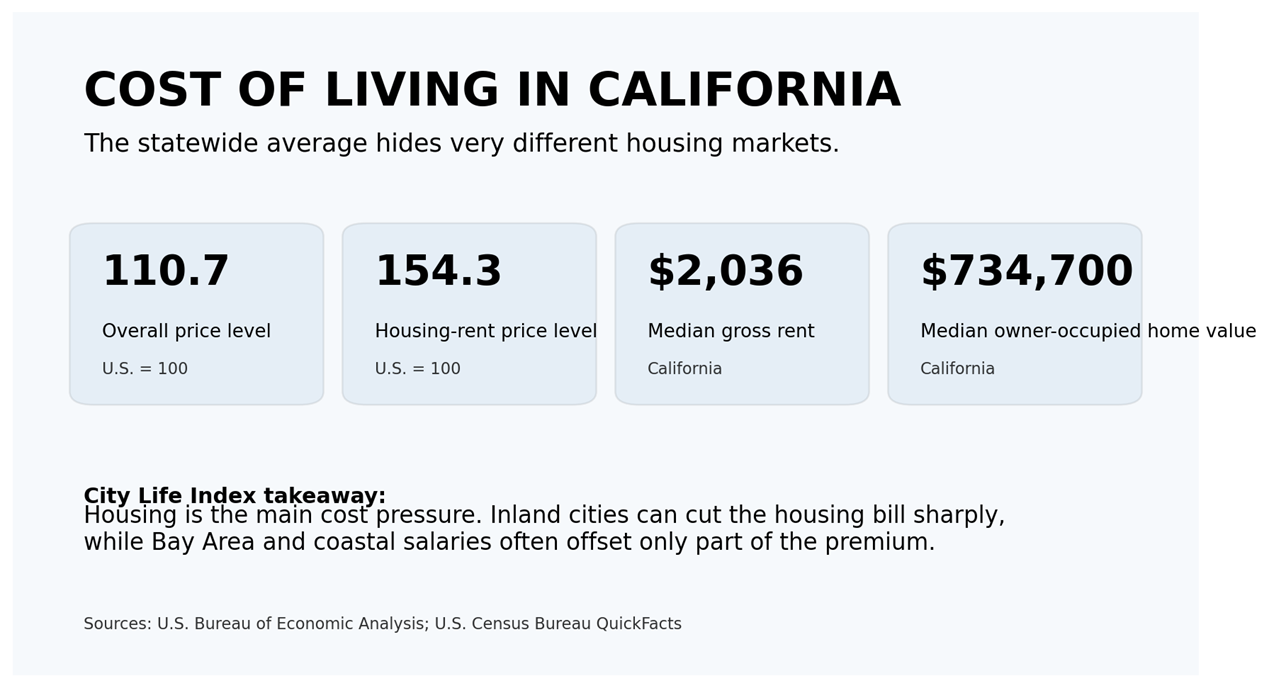
The cost of living in California is high by national standards, but the statewide average can be misleading. Federal price data show that California’s overall consumer price level is about 11% above the U.S. average, while the price level for housing rents is roughly 54% higher. That gap tells the story: housing is the main pressure point, and where you live inside California can change your budget dramatically.
A household considering California should look beyond a single cost-of-living index. Income, rent, home prices, taxes, commuting, and family size all matter. A salary that works in Fresno or Bakersfield may feel tight in San Diego, San Jose, or San Francisco, even before lifestyle spending is added.
Quick Answer
| QUICK ANSWER California is expensive overall, but the cost gap is not uniform. Housing does most of the damage. The statewide median gross rent is about $2,036 per month and the median owner-occupied home value is about $734,700. Major-city housing costs range widely: Fresno and Bakersfield sit far below coastal and Bay Area markets, while San Jose and San Francisco pair very high housing costs with much higher household incomes. |
Key Takeaways
- California’s overall price level is about 10.7% above the U.S. average on the BEA regional price parity measure.
- Housing rents are the outlier: California’s rent price level is about 54.3% above the national benchmark.
- The statewide median household income is about $99,122, which offsets part of the premium but does not eliminate the housing affordability gap.
- Among the major cities analyzed, Bakersfield, Fresno, Stockton, Sacramento, and Riverside have materially lower home-value-to-income ratios than Los Angeles, Oakland, San Francisco, San Jose, or San Diego.
- For renters, city choice matters just as much: Census median gross rent ranges from about $1,421 in Fresno to $2,669 in San Jose among the cities in this comparison.
- California’s statewide living-wage estimate for one adult with no children is about $30.48 per hour before lifestyle upgrades, debt payments, or aggressive saving.
How Expensive Is California Compared With the U.S.?
The cleanest public benchmark for statewide price levels is the U.S. Bureau of Economic Analysis Regional Price Parity, or RPP. An RPP of 100 equals the national price level. California’s all-items RPP is 110.7, which means the overall mix of consumer prices is about 10.7% above the U.S. level.
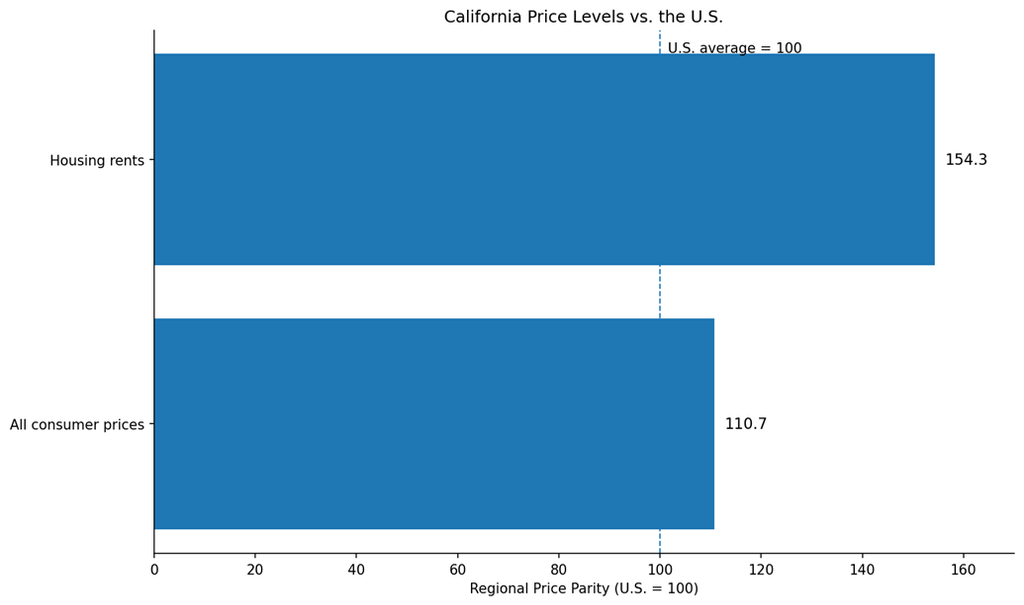
Source: U.S. Bureau of Economic Analysis, Regional Price Parities. U.S. = 100.
That headline number is much lower than many commercial cost-of-living indexes because methodologies differ. Some private indexes put heavier weight on housing or model the spending pattern of a specific household. The BEA measure is useful because it is built for geographic price comparisons using a consistent federal methodology.
The sharper number is housing rents: California’s rent RPP is 154.3. In practical terms, the statewide premium is not a story of every grocery item or service costing 50% more. It is primarily a story of expensive shelter, especially in coastal and job-rich metros.
Housing Is the Cost Driver
The Census Bureau’s recent multi-year estimates put California’s median gross rent at $2,036 per month and the median value of owner-occupied housing at $734,700. Median household income is about $99,122.
Those figures produce two useful, transparent affordability indicators:
- Annualized median gross rent is about 24.6% of median household income. This is not a household-level rent-burden rate; it is a broad comparison of two statewide medians.
- The median home value is about 7.4 times median household income. A higher multiple generally signals a harder path to ownership, especially when mortgage rates, insurance, property taxes, and maintenance are added.
Neither ratio tells you what an individual household can afford. They do, however, make city comparisons much more informative than looking at home prices alone.
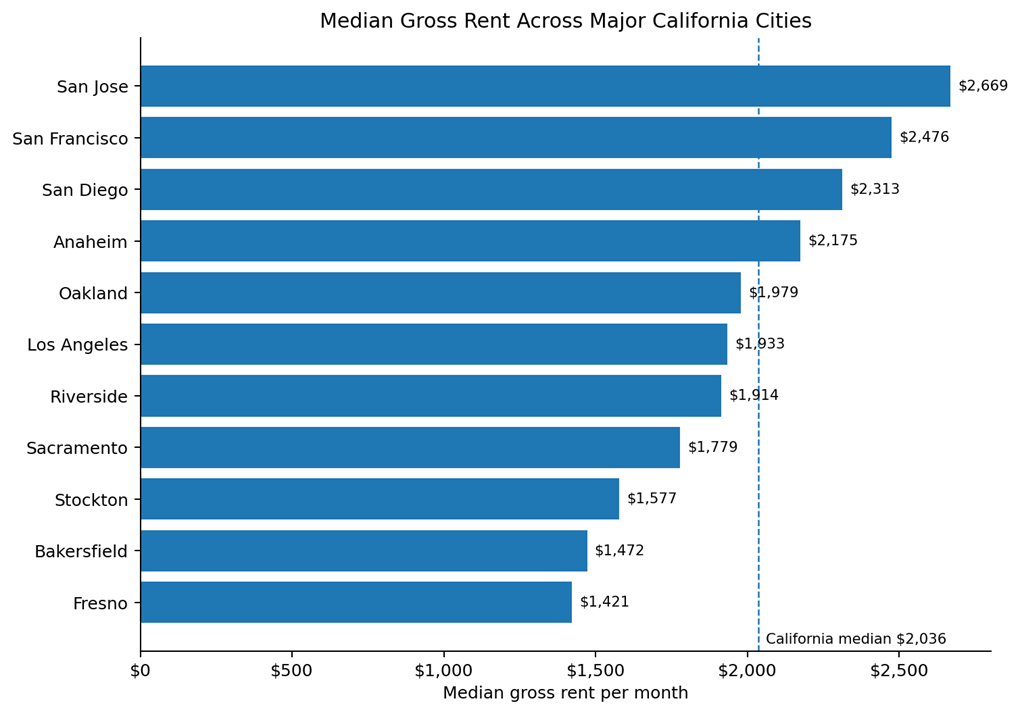
Source: U.S. Census Bureau QuickFacts, 2020–2024 estimates. Dashed line shows the California median.
Cost of Living by Major California City
California is not one housing market. The table below compares major cities using the same Census framework. Rent-to-income is annual median gross rent divided by median household income. Home-value-to-income is median owner-occupied home value divided by median household income. Both are City Life Index calculations designed for directional comparison, not personal underwriting.
| City | Median income | Median rent | Median home value | Rent / income | Home / income |
| Bakersfield | $80,540 | $1,472 | $371,700 | 21.9% | 4.6× |
| Fresno | $70,991 | $1,421 | $374,800 | 24.0% | 5.3× |
| Stockton | $79,907 | $1,577 | $440,900 | 23.7% | 5.5× |
| Sacramento | $87,321 | $1,779 | $506,300 | 24.4% | 5.8× |
| Riverside | $91,045 | $1,914 | $584,800 | 25.2% | 6.4× |
| San Diego | $108,077 | $2,313 | $906,700 | 25.7% | 8.4× |
| San Jose | $146,427 | $2,669 | $1,233,200 | 21.9% | 8.4× |
| Anaheim | $95,227 | $2,175 | $831,200 | 27.4% | 8.7× |
| Oakland | $101,600 | $1,979 | $929,900 | 23.4% | 9.2× |
| San Francisco | $140,970 | $2,476 | $1,394,500 | 21.1% | 9.9× |
| Los Angeles | $81,939 | $1,933 | $921,200 | 28.3% | 11.2× |
Central Valley: Lower Housing Costs, Lower Incomes
Bakersfield, Fresno, and Stockton offer the strongest housing-price relief in this major-city comparison. Their household incomes are below the statewide median, but home values fall even more sharply. Bakersfield’s home-value-to-income ratio is about 4.6×, Fresno’s about 5.3×, and Stockton’s about 5.5×.
- Bakersfield: relatively low median rent and the lowest home-value-to-income ratio in this comparison.
- Fresno: the lowest median gross rent in the group, but also the lowest median household income.
- Stockton: a middle ground between the Central Valley’s lower prices and access to the broader Northern California economy.
The trade-off is that lower housing costs do not automatically mean a higher overall quality of life. Job mix, summer heat, air quality, commute patterns, schools, and preferred amenities still matter.
Sacramento and Riverside: Middle-Cost Alternatives
Sacramento and Riverside sit between the high-cost coastal markets and the lower-cost Central Valley. Sacramento’s median home value is roughly 5.8× median household income; Riverside is about 6.4×. Both are below California’s statewide ratio of about 7.4×.
For people who want access to a large employment base without paying Bay Area or central-coastal housing prices, these cities deserve a serious budget comparison. The savings are meaningful, but commute geography can erase part of the advantage if work requires frequent travel into more expensive job centers.
Los Angeles and Anaheim: Rent Can Look Better Than Buying
Los Angeles is a good example of why renters and buyers may reach different conclusions. Its median gross rent is slightly below the statewide median in the Census data, but the median owner-occupied home value is roughly 11.2× median household income—the highest ratio in this major-city set.
Anaheim shows a similar, though less extreme, pattern. Median rent is above the state figure, and its home-value-to-income ratio is about 8.7×. For households prioritizing Southern California access, renting may preserve more flexibility than trying to force homeownership too early.
Bay Area: High Income, Higher Housing Barriers
San Jose and San Francisco have the highest household incomes in this comparison, but also some of the highest housing costs. San Jose’s median household income is about $146,427, while San Francisco’s is about $140,970. Those salaries provide more spending power than the statewide median, yet home values still sit at roughly 8.4× income in San Jose and 9.9× in San Francisco.
This is the core Bay Area trade-off: high compensation can make renting and daily expenses manageable for some professional households, but buying a home can still require a very different income, down payment, or dual-earner profile.
San Diego: Coastal Premium With Stronger Income
San Diego combines high housing costs with household income above the statewide median. Median gross rent is about $2,313, and the median owner-occupied home value is about $906,700. Its home-value-to-income ratio is around 8.4×.
For households that place a high value on coastal access, climate, and a diversified regional economy, that premium may be acceptable. The key is to compare the lifestyle value with the opportunity cost: less housing space, a longer saving timeline, or reduced monthly flexibility.
Oakland: Income Helps, but Ownership Remains Expensive
Oakland’s median household income is close to the statewide figure, and median rent is also near the state median. The ownership side is tougher: the median owner-occupied home value is about $929,900, or roughly 9.2× median household income.
That makes Oakland another market where a renter may experience a less extreme cost gap than a first-time buyer.
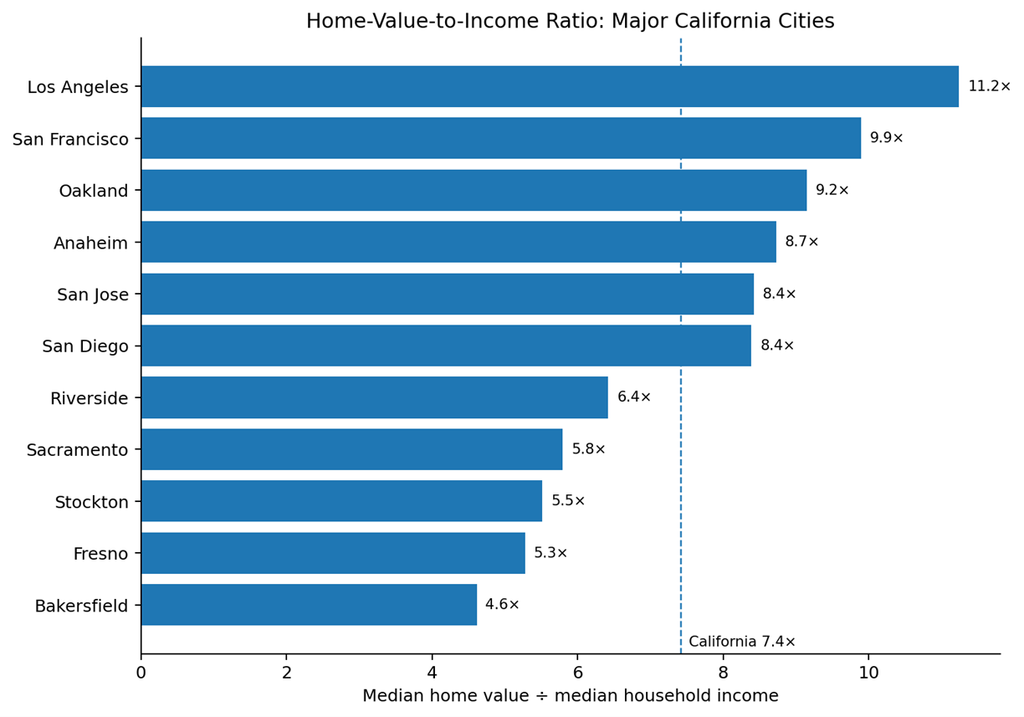
Source: U.S. Census Bureau QuickFacts; ratio calculated by City Life Index.
What Do Current Rent Benchmarks Look Like?
Census gross rent is valuable because it gives a consistent city-level measure, but it is a multi-year estimate. For a more current rental-market benchmark, HUD publishes annual Fair Market Rents for metropolitan rental markets.
HUD’s FMR is not the average asking rent. It is designed as a 40th-percentile gross-rent benchmark for standard-quality units occupied by recent movers, and it includes most tenant-paid utilities. That makes it useful as a standardized cross-market reference.
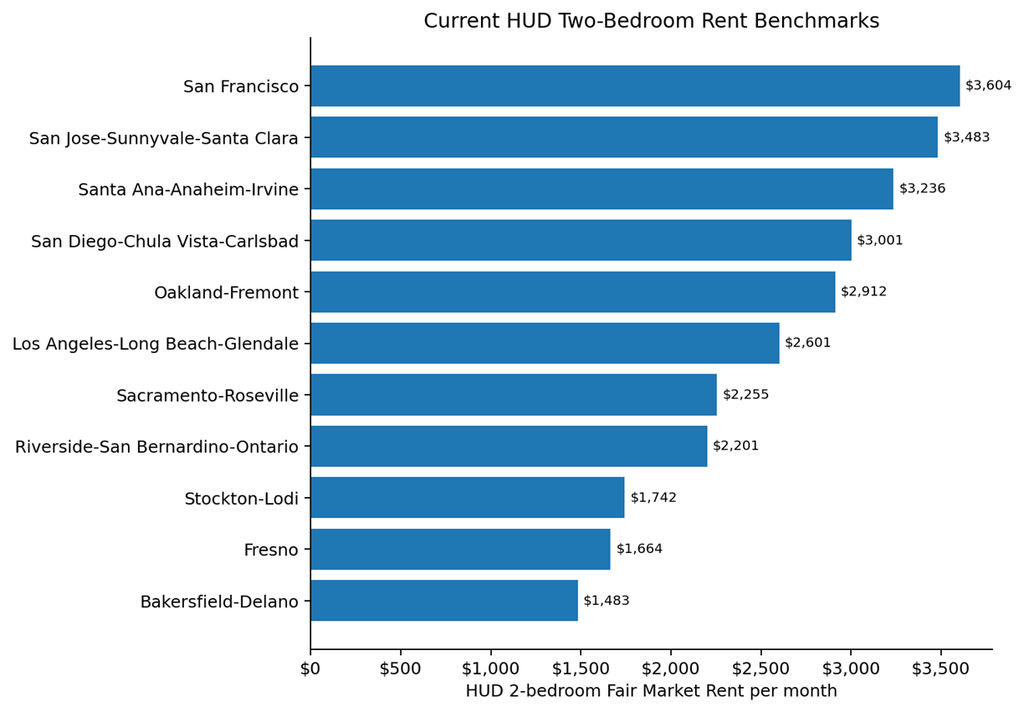
Source: U.S. Department of Housing and Urban Development, FY 2026 Fair Market Rents. FMRs are 40th-percentile gross-rent estimates, not median asking rents.
What Salary Do You Need to Live in California?
There is no single “California salary” that works for every household. A renter without children in Fresno has a different floor than a family buying a home in San Jose. Still, a living-wage model can provide a useful baseline.
MIT’s Living Wage Calculator estimates that a single adult with no children needs about $30.48 per hour statewide to cover basic needs at a full-time schedule. That is roughly $63,400 per year before taxes at 2,080 working hours.
- Single adult, no children: about $30.48/hour statewide.
- Two adults, both working, two children: about $36.38/hour per working adult in the statewide model.
- One adult supporting two children: the required hourly wage is much higher because childcare and housing must be covered by one earner.
Treat this as a basic-needs floor, not a comfortable-income target. Retirement saving, debt payoff, travel, private schooling, expensive hobbies, homeownership goals, or living in a high-cost coastal market can push the necessary income much higher.
Taxes: Part of the Budget, but Not the Whole Story
California uses a graduated state individual income tax, so the effective rate depends on taxable income and filing status. The state also applies a 7.25% base sales and use tax, with local district taxes increasing the total rate in many cities and counties.
For relocation planning, it is more useful to estimate your actual after-tax income than to compare top marginal rates. A household earning $90,000, a household earning $250,000, and a retiree living mainly on Social Security can have very different California tax outcomes.
- Use the California Franchise Tax Board calculator or current tax table for your filing status.
- Check the exact combined sales-tax rate for your address or city through CDTFA.
- If buying, model property taxes, homeowners insurance, HOA dues, and maintenance separately from the purchase price.
- If relocating for work, compare take-home pay after taxes with the new housing and commute budget—not salary alone.
Food, Utilities, Transportation, and Healthcare
Housing dominates the statewide gap, but it is not the only expense. Transportation can become expensive when long commutes require multiple vehicles, fuel, insurance, parking, and tolls. Utilities vary sharply by climate zone and housing type. Food and healthcare also differ by metro and household.
The most useful budgeting approach is to avoid a generic “California average” for these categories. Build a city-specific budget with the actual commute, vehicle count, utility setup, health plan, and household size you expect.
- Coastal areas may reduce cooling demand but often raise housing costs.
- Inland areas may lower rent or purchase prices but increase summer electricity use.
- A lower-cost suburb can stop being cheaper if a long commute adds substantial vehicle costs and time.
- Families should model childcare separately; it can rival housing as a major expense.
Renting vs. Buying in California
For many newcomers, renting first is financially useful because it lets you test a neighborhood and commute before committing to a high purchase price. The city data also show why the rent-versus-buy decision varies so much by location.
- In Los Angeles, Oakland, San Francisco, San Jose, Anaheim, and San Diego, home-value-to-income ratios are high enough that buying can require much more financial capacity than the median local household has.
- In Bakersfield, Fresno, Stockton, Sacramento, and Riverside, purchase prices are lower relative to local incomes, though mortgage rates and insurance still matter.
- A low rent-to-income ratio based on city medians does not guarantee that a newly listed apartment will be cheap; recently marketed rents can differ from the stock of existing leases captured in Census data.
Who California May Be a Strong Fit For
- Households with location-flexible income who can choose a lower-cost inland city without giving up earnings.
- Professionals in high-wage industries whose compensation materially offsets the coastal housing premium.
- Renters who value climate, job access, culture, or proximity to family enough to accept a smaller home or lower savings rate.
- Buyers willing to compare inland and secondary markets rather than limiting the search to the highest-cost coastal metros.
Who May Find the Cost Structure Difficult
- Single-income families that need a large home in a high-cost coastal market.
- First-time buyers with limited down-payment savings who are targeting Los Angeles, Bay Area, Orange County, or San Diego markets.
- Workers whose wages do not rise when they move to California.
- Households carrying large fixed payments for debt, childcare, or medical expenses.
A Practical Decision Framework
Use the state average as a starting point, then make the decision at the city and household level:
- Set your after-tax monthly income using your likely California salary.
- Cap a target housing budget before browsing neighborhoods.
- Compare at least three city types: one preferred coastal market, one middle-cost market such as Sacramento or Riverside, and one lower-cost inland market.
- Add commute and vehicle costs to the housing comparison.
- For buyers, calculate total ownership cost—not only the mortgage principal and interest.
- Keep a buffer for insurance, utilities, and other expenses that vary materially by location.
| CITY LIFE INDEX DECISION RULE If your job income is portable, the biggest affordability lever is often geography. If your job is tied to a high-cost metro, the biggest lever is usually housing choice: rent vs. buy, unit size, neighborhood, and commute. |
Bottom Line
California’s cost of living is above the national average, but a single statewide number hides the part that matters most: housing varies enormously by city. The state’s overall price level is about 10.7% above the U.S. benchmark, while housing rents are about 54.3% higher. That makes city selection and housing strategy more important than obsessing over small differences in everyday purchases.
For a relocation decision, compare income and housing together. Bakersfield, Fresno, Stockton, Sacramento, and Riverside provide much more favorable housing ratios than the most expensive coastal markets. San Jose and San Francisco offer higher incomes, but ownership costs remain demanding. Los Angeles and San Diego can make sense for households that value their specific job and lifestyle advantages enough to pay the premium.
| STATISTICS DISCLAIMER Statistics and cost figures in this article are estimates compiled from reliable and credible public, government, institutional and industry sources. Values may vary by source, geography, methodology and market conditions. The California Major-City Balance Score is a City Life Index model derived from sourced data and is not an official government measurement. |