
Safest Cities in California: Major Cities Ranked by Reported Crime
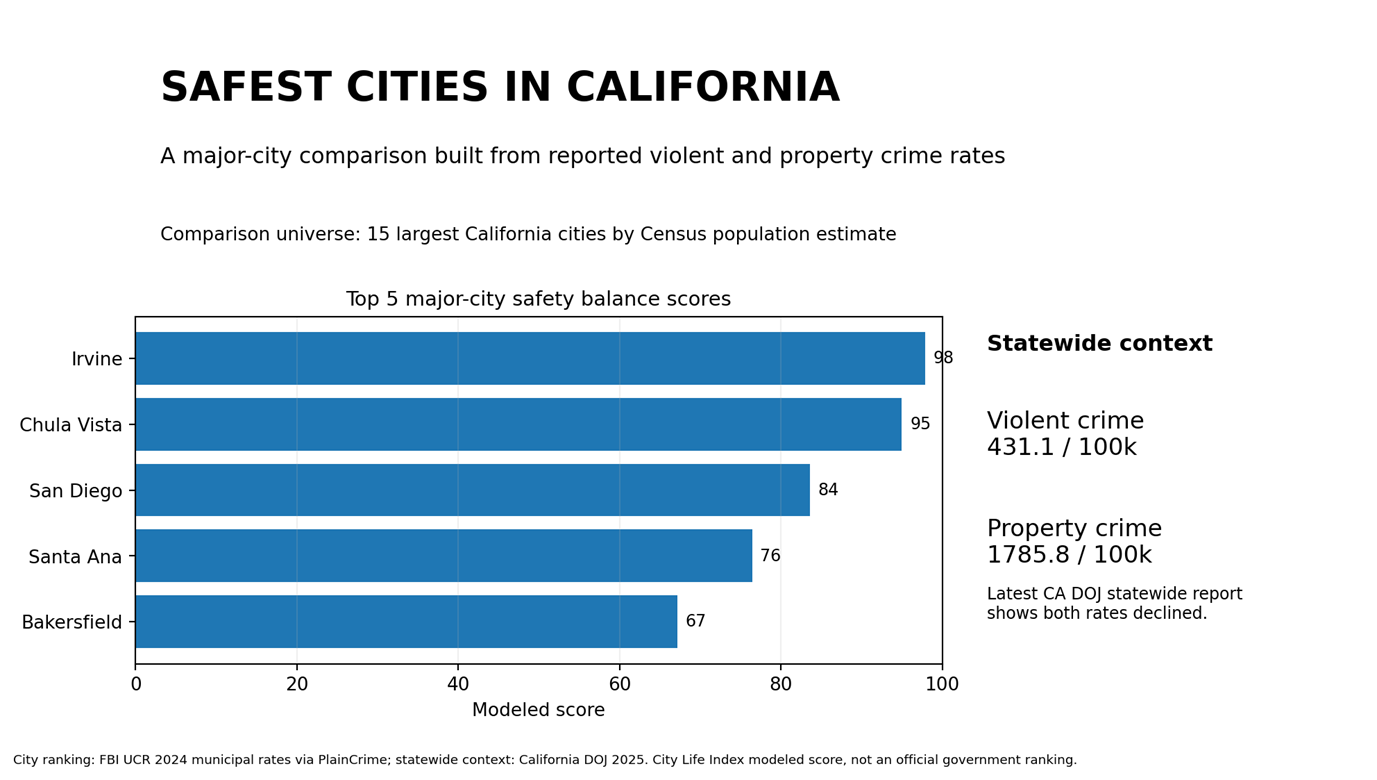
The safest cities in California depend heavily on what you mean by “city.” Many statewide lists are led by smaller suburbs and towns. For someone choosing between major job centers and large urban markets, that can be less useful. This City Life Index comparison focuses on California’s 15 largest incorporated cities and uses reported violent crime and property crime rates to create one consistent major-city benchmark. Within this group, Irvine stands out for exceptionally low reported violent crime, while Chula Vista combines the lowest property-crime rate in the group with a comparatively low violent-crime rate. San Diego also performs strongly for a city of its size. The ranking is a starting point, not a personal-risk forecast: neighborhood conditions, reporting practices, time of day, housing location, and individual circumstances can differ sharply inside any city.
Quick Answer
Among California’s 15 largest cities, the strongest reported-crime profiles in this comparison are:
- 1. Irvine – 84 violent crimes and 1390 property crimes per 100,000; modeled Safety Balance Score 98/100.
- 2. Chula Vista – 376 violent crimes and 1132 property crimes per 100,000; modeled Safety Balance Score 95/100.
- 3. San Diego – 412 violent crimes and 1670 property crimes per 100,000; modeled Safety Balance Score 84/100.
- 4. Santa Ana – 493 violent crimes and 1702 property crimes per 100,000; modeled Safety Balance Score 76/100.
- 5. Bakersfield – 555 violent crimes and 2470 property crimes per 100,000; modeled Safety Balance Score 67/100.
If you are open to smaller California municipalities, your shortlist will look different. Current statewide rankings from SafeWise and other publishers include places such as Danville, Rancho Santa Margarita, Lincoln, Moorpark, and Yorba Linda because their comparison universes are not limited to major cities.
Key Takeaways
- Irvine is the clearest low-crime outlier among major California cities in this dataset, especially on violent crime.
- Chula Vista has the lowest property-crime rate in the 15-city comparison and a relatively low violent-crime rate.
- San Diego performs well at big-city scale, ranking third in the City Life Index major-city model.
- Los Angeles illustrates why one-dimensional rankings can mislead: its violent-crime rate is higher than the state benchmark, while its property-crime rate in this dataset is lower than many other large California cities.
- California’s latest statewide report shows broad improvement in violent and property crime, but a statewide decline does not erase large differences between cities or neighborhoods.
- A citywide crime rate should be used alongside housing, commute, school, health, and neighborhood-level research before a relocation decision.
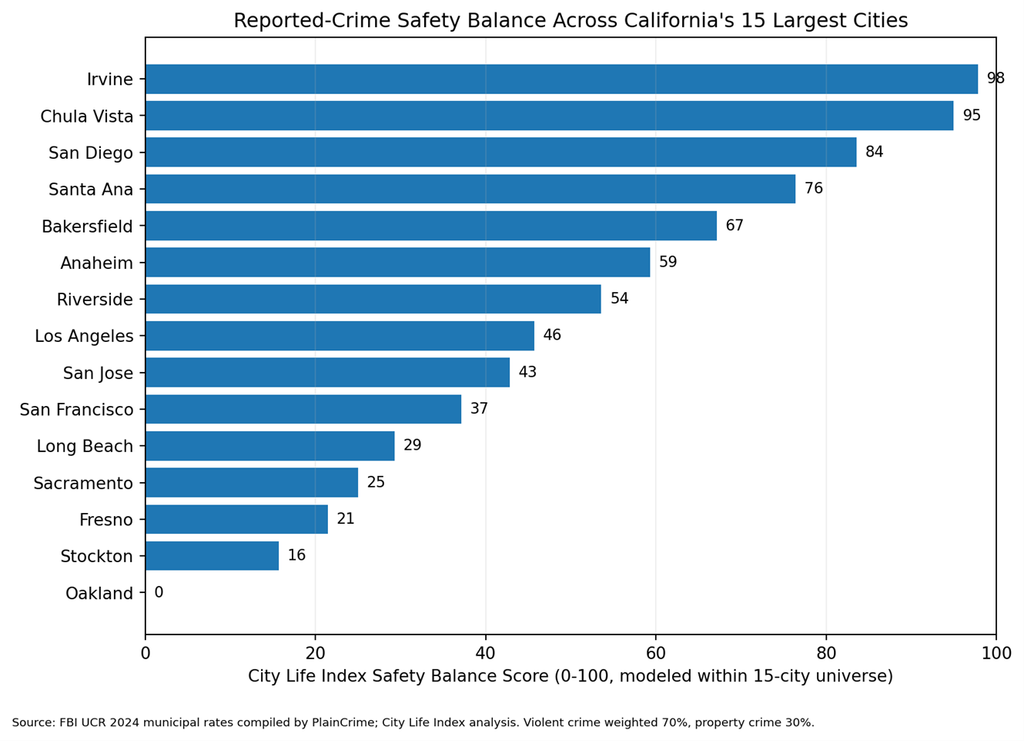
Source: FBI UCR 2024 municipal rates compiled by PlainCrime; City Life Index analysis. Score is relative only to the 15-city comparison universe.
Major California Cities Ranked by Reported Crime
| Rank | City | Violent /100k | Property /100k | Modeled score | Same-year CA benchmark |
| 1 | Irvine | 84.0 | 1389.7 | 98 | V below CA / P below CA |
| 2 | Chula Vista | 375.8 | 1132.4 | 95 | V below CA / P below CA |
| 3 | San Diego | 412.0 | 1670.0 | 84 | V below CA / P below CA |
| 4 | Santa Ana | 493.1 | 1702.2 | 76 | V above CA / P below CA |
| 5 | Bakersfield | 555.0 | 2470.0 | 67 | V above CA / P above CA |
| 6 | Anaheim | 596.2 | 2132.1 | 59 | V above CA / P above CA |
| 7 | Riverside | 589.7 | 2832.1 | 54 | V above CA / P above CA |
| 8 | Los Angeles | 728.5 | 1484.0 | 46 | V above CA / P below CA |
| 9 | San Jose | 607.0 | 2588.0 | 43 | V above CA / P above CA |
| 10 | San Francisco | 597.0 | 3929.0 | 37 | V above CA / P above CA |
| 11 | Long Beach | 676.0 | 3479.0 | 29 | V above CA / P above CA |
| 12 | Sacramento | 755.0 | 2547.0 | 25 | V above CA / P above CA |
| 13 | Fresno | 736.0 | 3271.0 | 21 | V above CA / P above CA |
| 14 | Stockton | 1145.8 | 2639.6 | 16 | V above CA / P above CA |
| 15 | Oakland | 1925.3 | 7230.0 | 0 | V above CA / P above CA |
Modeled score: inverted rank-percentile score within this 15-city universe; violent crime receives 70% weight and property crime 30%. A score of 0 means last in this comparison, not “zero safety.” Crime rates are reported offenses, not victimization probabilities.
1. Irvine – the strongest major-city crime profile
Irvine ranks first in this major-city comparison because its reported violent crime rate is dramatically lower than every other city in the 15-city universe, while property crime also remains below the California same-year benchmark. That combination creates unusually strong separation from the rest of the field.
- Best fit: people who want a large Orange County job market with a lower reported-crime profile than other major California cities.
- Tradeoff: a low crime rate does not make Irvine a low-cost choice; housing affordability should be checked separately before treating safety as the deciding factor.
- Decision note: compare specific neighborhoods, commute patterns, and housing costs rather than assuming the citywide average describes every block.
2. Chula Vista – unusually low property crime for a large city
Chula Vista places second because it combines the lowest reported property-crime rate in the group with violent crime that is also below California’s same-year statewide rate. For readers who want San Diego County access without choosing central San Diego, it deserves a serious look.
- Best fit: households prioritizing lower reported crime with access to the broader San Diego employment and lifestyle region.
- Tradeoff: the city is geographically large and neighborhood conditions vary; location inside Chula Vista matters.
- Decision note: Chula Vista’s FBI reporting-year denominator differs slightly from Census population estimates, which is normal when crime and population datasets use different reporting systems.
3. San Diego – strong safety performance at very large-city scale
San Diego ranks third. Its reported violent-crime rate is above the national benchmark but below California’s same-year rate, while its property-crime rate is also below the state benchmark in this dataset. For a city with more than a million residents, that balance is notable.
- Best fit: readers who want a major employment market, coastal lifestyle, and a comparatively favorable large-city crime profile.
- Tradeoff: citywide averages can hide substantial neighborhood variation; housing cost and commute geography may matter as much as the city-level crime rate.
- Decision note: if San Diego is on your shortlist, move from city-level ranking to neighborhood-level due diligence before signing a lease or buying.
4. Santa Ana – lower property crime, moderate violent-crime tradeoff
Santa Ana ranks fourth in the model. Its property-crime rate is below California’s same-year statewide benchmark, while its violent-crime rate is slightly above that benchmark. This is a good example of why readers should look at the two crime families separately rather than relying on one “total crime” number.
5. Bakersfield – stronger violent-crime position than its property-crime position
Bakersfield ranks fifth because its violent-crime rate is lower than several other major California cities, even though property crime is above the statewide benchmark. A violent-heavy weighting therefore places it ahead of some cities with lower property crime but higher violent crime.
How the Rest of the Major-City Field Compares
The middle of the ranking is less clear-cut. Anaheim, Riverside, Los Angeles, San Jose, and San Francisco each have different combinations of violent and property crime. Los Angeles, for example, has a comparatively lower property-crime rate in this dataset but a higher violent-crime rate. San Francisco has a lower violent-crime rate than several peers but a much higher property-crime rate. Those different profiles can matter depending on whether your priority is personal violence risk, theft/property exposure, or both.
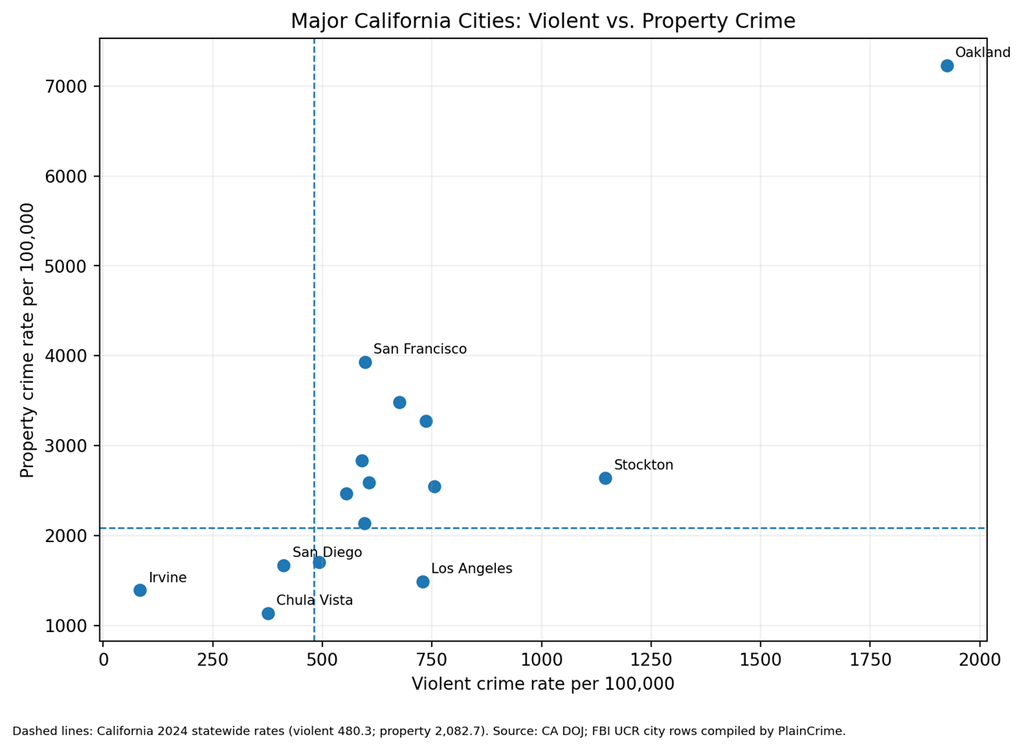
Source: FBI UCR 2024 city rates compiled by PlainCrime; California 2024 statewide benchmark from California DOJ.
Why This Ranking Differs From Other “Safest Cities” Lists
Search results for this topic often disagree, and the disagreement is usually methodological rather than mysterious. Rankings can change because they use different:
- Population thresholds – some lists include towns with fewer than 20,000 residents; this page uses the 15 largest California cities.
- Crime weights – one publisher may rank only violent crime, another may blend violent and property crime, and another may use a proprietary grade.
- Data years – crime reporting updates on a lag and different publishers refresh at different times.
- Reporting-completeness rules – agencies that fail a completeness threshold may be excluded from one ranking but not another.
- Additional factors – some “safety” lists add traffic deaths, natural hazards, financial safety, or survey responses. This ranking does not.
City Life Index intentionally keeps the ranking narrow: reported violent and property crime. That makes it reproducible and easier to interpret, while the rest of the article handles relocation tradeoffs separately.
California Crime Is Improving Statewide – but City Differences Still Matter
California’s latest statewide criminal-justice report shows a substantial decline in both violent and property crime compared with the prior year. The homicide rate also fell to a record low in the state series. That is useful context for relocation research, but it should not be mixed directly into a city ranking built from a different reporting vintage.
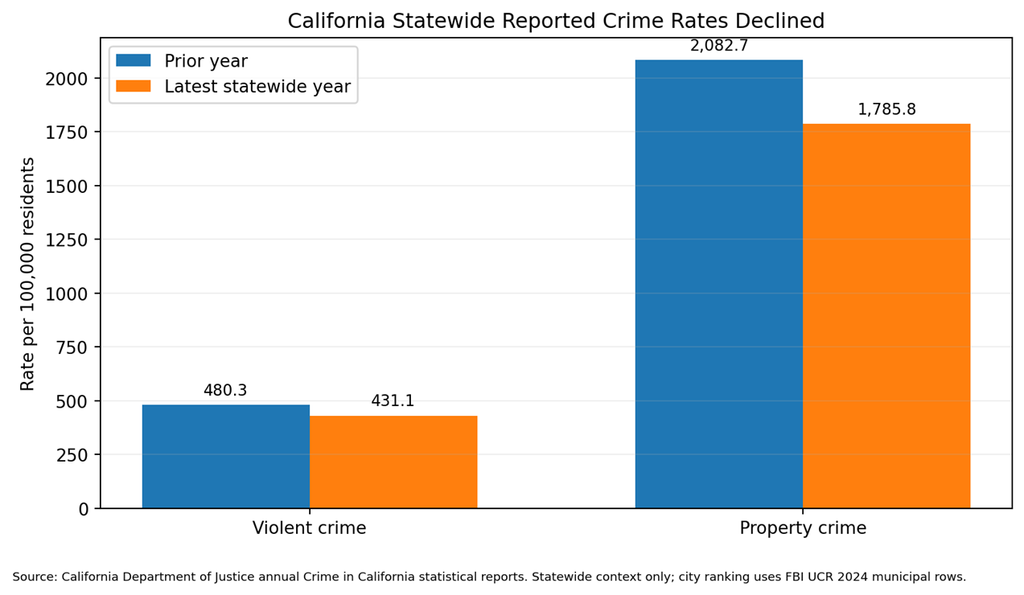
Source: California Department of Justice, Crime in California annual statistical reports. Statewide context only.
What Crime Rates Can – and Cannot – Tell You
Crime rates are useful because they put reported offenses on a per-capita basis, making cities of very different sizes more comparable. But they are not a complete measure of personal safety.
- Reported crime is not all crime. Not every offense is reported to law enforcement, and reporting behavior can differ by community and offense type.
- City boundaries are blunt. A citywide rate can combine neighborhoods with very different conditions.
- Agency reporting matters. FBI and California DOJ data depend on participating law-enforcement submissions, and both agencies document completeness and transition limitations.
- Exposure differs. A person’s routine, housing location, commute, nightlife, work schedule, and transportation choices change real-world exposure.
- Crime rate is not quality of life. Housing cost, schools, healthcare, climate, commute, and job access can outweigh small differences in citywide crime rates.
Who These Major Cities May Fit Best
| Priority | Cities to examine | Why |
| Lower-crime major-city priority | Irvine | Strongest major-city reported-crime profile in this comparison. |
| San Diego-region access | Chula Vista | Low property crime and comparatively low violent crime within a large urban region. |
| Big-city scale + relatively favorable crime profile | San Diego | Third in the model while offering a very large labor and amenity base. |
| Orange County access with more urban intensity | Santa Ana / Anaheim | Middle-to-upper tier in the major-city comparison, with different violent/property mixes. |
| Lower-cost California search | Bakersfield | Safety profile is mixed; evaluate housing savings against property-crime and lifestyle tradeoffs. |
A Better Relocation Decision Framework
Use this ranking as a filter, not a final verdict. A practical sequence is:
- Step 1: shortlist 3-5 cities using citywide violent/property crime as a first pass.
- Step 2: compare housing and total cost so a safety gain does not create an unsustainable budget.
- Step 3: compare commute and job access because daily travel can change which neighborhoods are realistic.
- Step 4: research neighborhoods using local police dashboards, recent incident maps, and visits at the times you would actually be outside.
- Step 5: verify current conditions before signing a lease or buying, because annual crime tables always lag real time.
Choose Irvine if your first priority is the strongest major-city crime profile in this comparison and the housing budget works. Consider Chula Vista or San Diego if you want a strong safety profile with access to a larger coastal metro ecosystem. Look beyond the score if affordability, transit, schools, or career fit matter more than a few ranking positions.
Bottom Line
For readers comparing California’s largest cities, Irvine ranks first in the City Life Index major-city safety model, followed by Chula Vista and San Diego. The result does not mean those places are uniformly safe or that lower-ranked cities are uniformly unsafe. It means their reported violent and property crime rates compare more favorably within this specific 15-city universe. The strongest relocation decision will pair this city-level evidence with neighborhood research, housing affordability, daily mobility, and the parts of life you actually value.
Disclaimer: Statistics and crime-rate figures in this article are estimates or reported-rate calculations compiled from reliable and credible public, government, institutional, and industry sources. Values may vary by source, geography, methodology, reporting completeness, and data vintage. The City Life Index Safety Balance Score is a modeled comparison tool, not an official government safety rating or a prediction of personal risk.