
Best Cities in California for Jobs
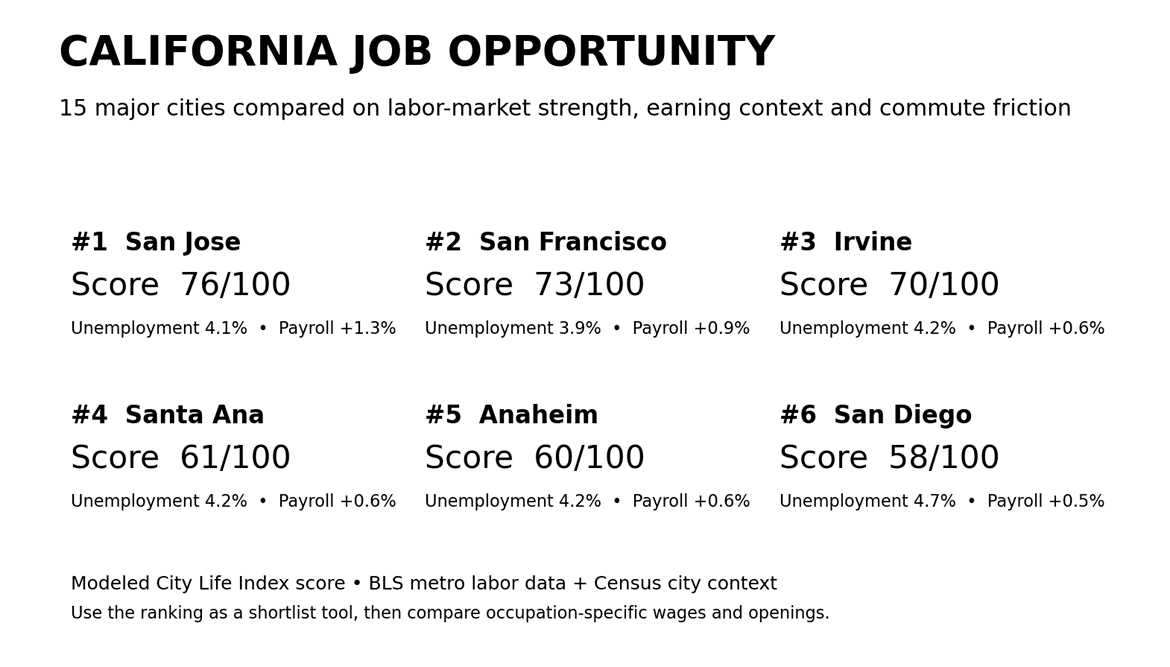
The best cities in California for jobs are not necessarily the places with the highest household incomes or the biggest populations. A useful job-market comparison has to look at several things at once: how tight the labor market is, whether payrolls are growing, how deep the employment base is, what local earning power looks like, and how much daily friction comes with reaching work.
Using a transparent six-factor model across 15 major California cities, San Jose, San Francisco and Irvine rise to the top of this comparison. They get there in different ways. San Jose combines strong payroll growth with high income; San Francisco pairs the lowest unemployment rate in the comparison with high earning power; Irvine benefits from the broader Orange County job market and strong city-level income. The ranking is a starting point—not a substitute for checking openings and pay in your occupation.
Quick Answer
- San Jose offers the strongest overall modeled balance for job seekers in this major-city comparison.
- San Francisco has the tightest labor market in the dataset and very high household income, but cost and commute tradeoffs remain substantial.
- Irvine combines a relatively low Orange County unemployment rate with high city-level income and a shorter commute than several coastal peers.
- Fresno has the fastest recent payroll growth in the comparison, but a much higher unemployment rate keeps it out of the top tier.
- Los Angeles has by far the deepest job base, yet scale alone does not overcome a higher unemployment rate and weaker city-level income/commute metrics in this model.
How This Ranking Works
City Life Index uses a modeled Job Opportunity Score rather than copying a third-party ranking. The model blends current BLS labor-market measures with city-level Census context. Metro or metropolitan-division data are used for unemployment, payroll growth and job-market depth because that is how many official labor statistics are published. City-level data are used for household income, labor-force participation and commute time.
- 30% — lower unemployment rate
- 25% — stronger year-over-year payroll employment growth
- 15% — larger nonfarm employment base, log-scaled so Los Angeles does not overwhelm every other market
- 15% — higher median household income (context, not a wage measure)
- 10% — higher labor-force participation
- 5% — shorter mean commute time
All six inputs are normalized across the 15-city comparison universe before weighting. Cities that share the same labor market—for example Anaheim, Santa Ana and Irvine—share the same BLS labor-market figures but differ on their city-level Census context. That is intentional.
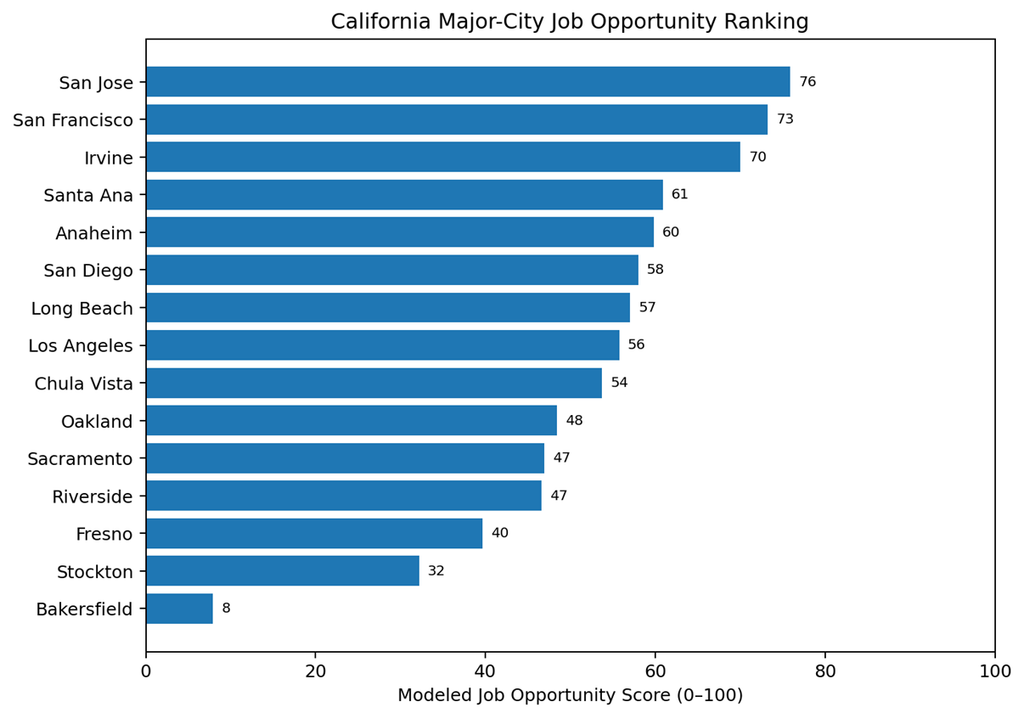
Source: U.S. Bureau of Labor Statistics; U.S. Census Bureau QuickFacts; City Life Index calculations. Data vintages documented in Methodology.
1. San Jose
San Jose leads because the labor market combines 4.1% unemployment, +1.3% payroll growth and one of the highest household incomes in the comparison. The San Jose-Sunnyvale-Santa Clara market is large enough to offer depth without relying on Los Angeles-scale employment volume.
- Strong fit when you prioritize a tight labor market and high earning context.
- Major tradeoff: strong job metrics do not imply easy housing affordability.
- Best next step: compare occupation-specific wages and openings before relocating.
2. San Francisco
San Francisco places second with the lowest unemployment rate in the comparison (3.9%), positive payroll growth and very high household income. Its score would be even stronger without the longer commute metric. The city remains a powerful job platform, but employment strength and affordability are separate questions.
- Strong fit for job seekers who can capture the market’s earning potential.
- Commute and housing costs can materially change the practical value of a higher salary.
- Use the housing and cost-of-living guides alongside this ranking.
3. Irvine
Irvine ranks third. It shares Orange County’s 4.2% unemployment rate and sizable payroll base, while its city-level household income is among the highest in the comparison. A relatively short mean commute also helps.
- Strong balance of labor-market access and city-level earning context.
- Its labor-market score comes from the broader Anaheim-Santa Ana-Irvine division, not Irvine alone.
- Especially useful as a Southern California alternative to larger Los Angeles.
4. Santa Ana
Santa Ana benefits from the same relatively tight Orange County labor market as Irvine and Anaheim. Its modeled score gets an additional lift from a shorter mean commute than Anaheim and solid labor-force participation.
- Large shared Orange County employment base.
- Household income is lower than Irvine’s, which matters in the model.
- A practical option for people prioritizing access to Orange County jobs over prestige rankings.
5. Anaheim
Anaheim follows closely behind Santa Ana. The Orange County division’s low unemployment and large job base do most of the work, while Anaheim’s city-level income is solid but not at Irvine’s level.
- Strong shared labor market with 1.69 million payroll jobs.
- Moderate recent payroll growth rather than a boom.
- Good candidate for side-by-side cost and commute analysis.
6. San Diego
San Diego combines 4.7% unemployment, a large employment base, high household income and one of the shortest commutes among the top cities. Payroll growth is positive but moderate, which keeps it below the Bay Area and Orange County leaders.
- Balanced labor-market profile with fewer extreme weaknesses.
- Income context is strong, but the page should not confuse household income with wages.
- A strong shortlist city when career opportunity and day-to-day practicality both matter.
7. Long Beach
Long Beach sits inside the Los Angeles-Long Beach-Glendale labor market, so it benefits from the largest employment base in this comparison. Its city-level labor-force participation is solid, but the broader division’s unemployment rate and a longer commute hold the score to the middle of the pack.
- Access to a huge Southern California job ecosystem.
- The model does not give full credit for size because job depth is log-scaled.
- Job location and commute direction can matter more than city boundaries here.
8. Los Angeles
Los Angeles has unmatched market depth: roughly 4.58 million nonfarm payroll jobs in its metropolitan division in the comparison period. But the model also sees a 5.2% unemployment rate, modest payroll growth and a long mean commute. That produces a mid-table score despite enormous sector variety.
- Best in the comparison for sheer scale, not for every balance metric.
- A city this large should be evaluated by occupation and submarket, not one headline score.
- Use neighborhood and commute analysis before treating metro opportunity as personally accessible.
9. Chula Vista
Chula Vista shares the San Diego metro’s 4.7% unemployment rate and positive payroll growth. Its city-level household income is strong, but a lower labor-force participation rate and longer mean commute than San Diego reduce its modeled score.
- Access to the same broad San Diego labor market.
- Good alternative when housing location matters more than city-center proximity.
- Compare commuting patterns to the actual employer location.
10. Oakland
Oakland has strong city-level income and labor-force participation, while the Oakland-Fremont-Berkeley division remains a large employment base. The current weakness is payroll momentum: nonfarm employment is down 0.4% year over year in the comparison period.
- High earning context and labor participation.
- Recent payroll contraction weighs heavily because the score rewards momentum.
- Education and health services were still growing even as several other sectors contracted.
11. Sacramento
Sacramento is a stable, sizable labor market rather than the fastest-growing one in this snapshot. Unemployment is 5.0% and payrolls are up only modestly, but the region’s job base is large enough to provide breadth.
- Useful for job seekers who value market stability over headline growth.
- Education and health services were a relative growth area in the BLS industry detail.
- The city’s moderate commute helps compared with several larger coastal markets.
12. Riverside
Riverside benefits from the Inland Empire’s large job base and positive payroll growth, but a 5.7% unemployment rate and the longest commute among the higher-ranked large markets weigh on the model.
- Deep regional labor market with more than 1.7 million payroll jobs.
- Job access can be diluted by long commuting distances.
- Especially important to compare employer geography before moving.
13. Fresno
Fresno is the most interesting lower-ranked city in the model because its labor market is growing quickly. Payroll employment is up 2.5% year over year, the fastest rate in this 15-city comparison. However, unemployment remains 7.7%, and city-level income and labor-force participation are lower than in the leading coastal markets.
- Strong recent momentum deserves attention.
- Education and health services and leisure/hospitality were among the stronger BLS sectors.
- A growth story can coexist with a still-loose labor market; both matter.
14. Stockton
Stockton also shows meaningful payroll momentum at +1.5%, but the market is smaller and unemployment remains 6.4%. The result is a lower overall score despite pockets of strong sector growth.
- Education and health services and government showed notable recent gains.
- Smaller job-market depth increases occupation-specific risk.
- Best evaluated with a concrete employer shortlist rather than broad averages.
15. Bakersfield
Bakersfield ranks last in this particular snapshot because unemployment is the highest in the comparison at 8.6% and total payroll employment is slightly lower than a year earlier. That does not mean there are no good careers; it means the broad labor-market indicators are less favorable than the other 14 cities right now.
- Education and health services still showed positive growth.
- Broad market weakness can coexist with strong demand in specific occupations.
- Do not use the overall score to dismiss a confirmed job offer or specialized career path.
What the Labor-Market Scatter Reveals
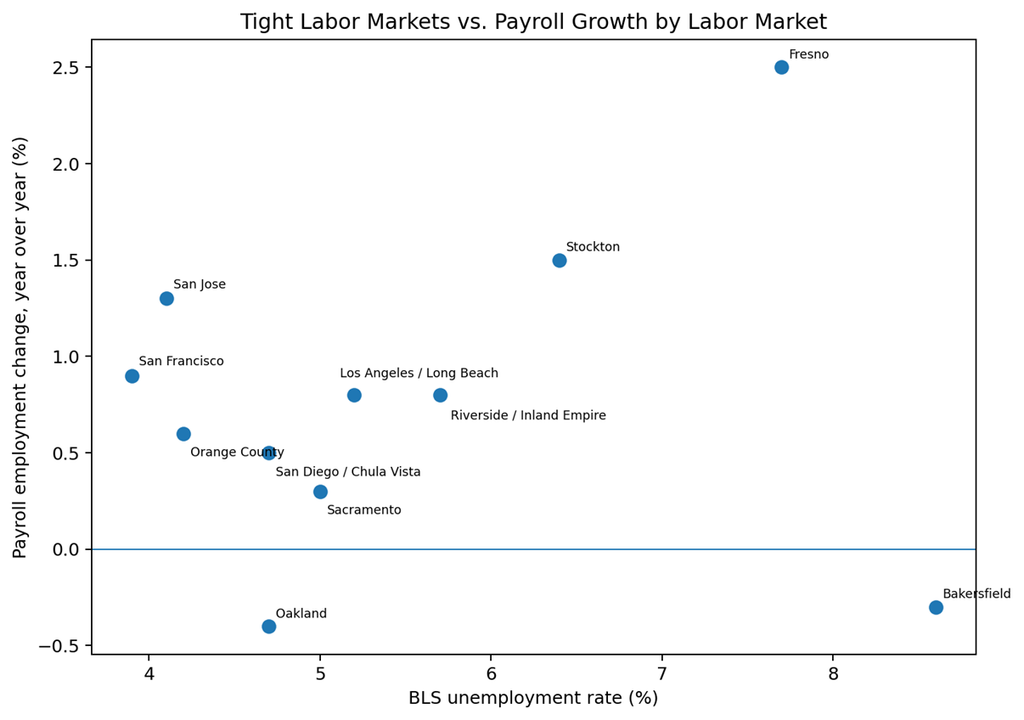
Source: BLS metro/metropolitan-division labor data. Cities sharing a labor market share the same BLS point.
The scatter is useful because it prevents one-dimensional rankings. Fresno and Stockton have faster payroll growth but still-elevated unemployment. San Francisco, San Jose and Orange County cities have tighter labor markets but more moderate growth. For a job seeker, the first pattern can signal expanding opportunity with more available workers; the second can signal a tighter market where employers may compete more aggressively for qualified labor.
Where Payroll Growth Is Strongest
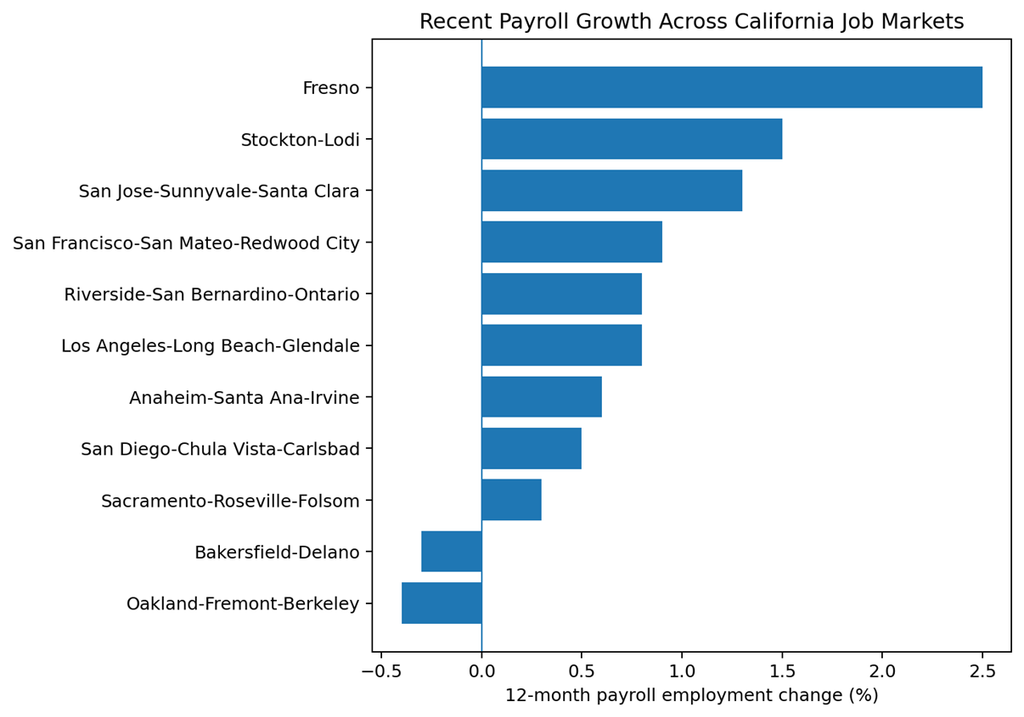
Source: BLS, July 2026 nonfarm payroll employment, not seasonally adjusted. Distinct labor markets shown once.
How to Use the Ranking for Your Career
- If you want market tightness, prioritize lower unemployment—but verify that demand exists for your occupation.
- If you want momentum, look for positive payroll growth, then identify which industries are driving it.
- If you want maximum employer breadth, favor deeper markets such as Los Angeles, Orange County, Riverside/Inland Empire, San Diego or the Bay Area.
- If you are relocating for a specific offer, the confirmed role, compensation, commute and housing budget matter more than the city’s composite score.
- If you are searching without an offer, build a shortlist of two or three labor markets and compare job postings, wage data and cost of living before moving.
Bottom Line
For a broad, major-city job search, San Jose, San Francisco and Irvine offer the strongest modeled combinations in this dataset. But the ranking is designed to narrow the field, not make the decision for you. Los Angeles offers unmatched scale; Fresno offers unusually strong recent payroll growth; Sacramento offers a large and relatively stable market; and every city has occupations that can perform better or worse than the metro headline.
The best next step is to take your top two or three cities and compare occupation-specific openings, wages, employer locations, housing costs and commute patterns. That turns a statewide ranking into a decision you can actually use.
Disclaimer: Statistics and cost figures in this article are estimates compiled from reliable and credible public, government, institutional, and industry sources. Values may vary by source, geography, methodology and market conditions. City Life Index scores are modeled comparisons, not official government measurements or guarantees of employment.