
Housing in California: What Buyers and Renters Should Know
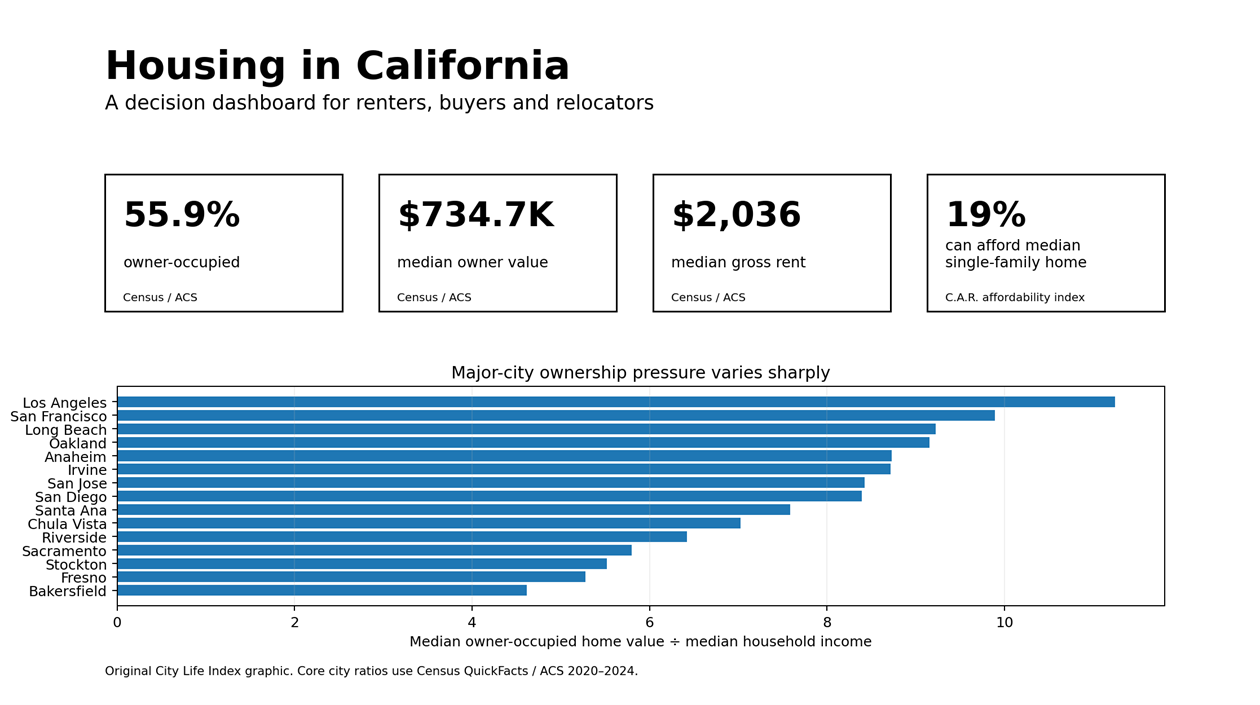
Housing in California is expensive by almost any national benchmark, but a single statewide price hides the decision that actually matters: where you live, whether you rent or buy, and how housing costs compare with local income. California’s housing market ranges from inland cities where home values are closer to five times local household income to coastal cities where the ratio approaches or exceeds nine or ten times income.
For renters, the same pattern appears in a different form. Statewide rent levels are far above the U.S. benchmark, yet the pressure varies sharply by metro and city. The result is not one California housing market but a set of regional markets with very different entry costs, rents and ownership tradeoffs.
This guide uses U.S. Census, HUD, BEA, California Association of Realtors, and Legislative Analyst’s Office data to separate durable housing fundamentals from short-term market noise.

Quick Answer
California offers enormous housing variety, but affordability remains the central constraint. Recent Census estimates put the statewide median value of owner-occupied homes at about $734,700 and median gross rent at about $2,036 per month. Current market measures can be higher because they track different things: closed sales, listings or single-family homes rather than the full stock of owner-occupied housing.
- More attainable major-city ownership: Bakersfield, Fresno, Stockton, Sacramento and Riverside have lower home-value-to-income ratios than the coastal leaders in this comparison.
- High-income but still expensive: San Jose and San Francisco pair very high local incomes with very high home values. Their renter ratios look less extreme than their ownership ratios.
- Highest pressure in this comparison: Los Angeles combines a high home-value-to-income ratio with one of the largest rent-to-income ratios among the selected major cities.
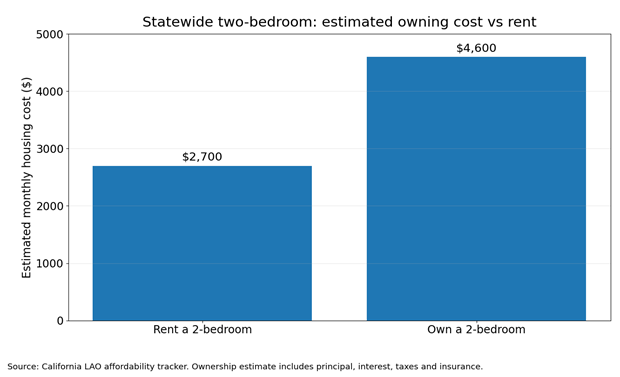
- Renting often has a lower monthly entry cost than buying: statewide analysis of a two-bedroom home shows a large current monthly gap between estimated ownership cost and rent.
- There is no single ‘California home price’: Census, MLS-based sale prices, listing portals and C.A.R. measure different housing universes.
California Housing at a Glance

Why California Housing Feels So Expensive
The strongest statewide signal is the size of the housing premium relative to the rest of the country. The Bureau of Economic Analysis estimates California’s housing-rent price level at 154.3 when the U.S. average equals 100. That does not mean every lease is 54.3% higher than every comparable U.S. lease; it means the state’s rental price level is exceptionally high in aggregate.
The ownership side is also difficult. Census QuickFacts shows a statewide median owner-occupied home value of $734,700, while market-focused sources report different numbers depending on the property type and transaction universe. The California Association of Realtors recently reported a statewide existing single-family median above $900,000, while all-home sale and listing measures were lower.
The practical lesson is simple: source definition matters. Use Census data for a stable comparison of places and households. Use market data for what a buyer is likely to encounter now. Do not treat the two as interchangeable.
Why ‘California Home Price’ Can Mean Four Different Things
Housing articles often cite one statewide number without explaining what it represents. That can make reliable sources look inconsistent when they are actually measuring different things.
| Source | Reported value | What it measures | Data vintage |
| Census ACS / QuickFacts | $734,700 | Median value of owner-occupied housing stock | 2020–2024 |
| Redfin | $746,890 | Median sale price, all home types | Aug. 2026 |
| Realtor.com | $744,750 | Median listing price | Aug. 2026 |
| C.A.R. | $901,420 | Median existing single-family sale price | Aug. 2026 |
- Census / ACS value: a durable estimate of owner-occupied housing stock, useful for geographic comparisons.
- Redfin sale price: transaction-based, all-home market data and therefore more sensitive to the mix of homes sold.
- Realtor.com listing price: the asking-price side of the market, not the same as a closed sale.
- C.A.R. single-family median: a narrower ownership-market measure focused on existing detached single-family homes.
Renting in California
For renters, statewide median gross rent is useful as a baseline, but metro-level rental benchmarks are often more actionable. HUD’s Fair Market Rents show how quickly the cost of a two-bedroom rental changes across California. The selected metro-area benchmark ranges from roughly the mid-$1,000s in Bakersfield and Fresno to more than $3,000 in San Diego, Orange County, San Jose and San Francisco.
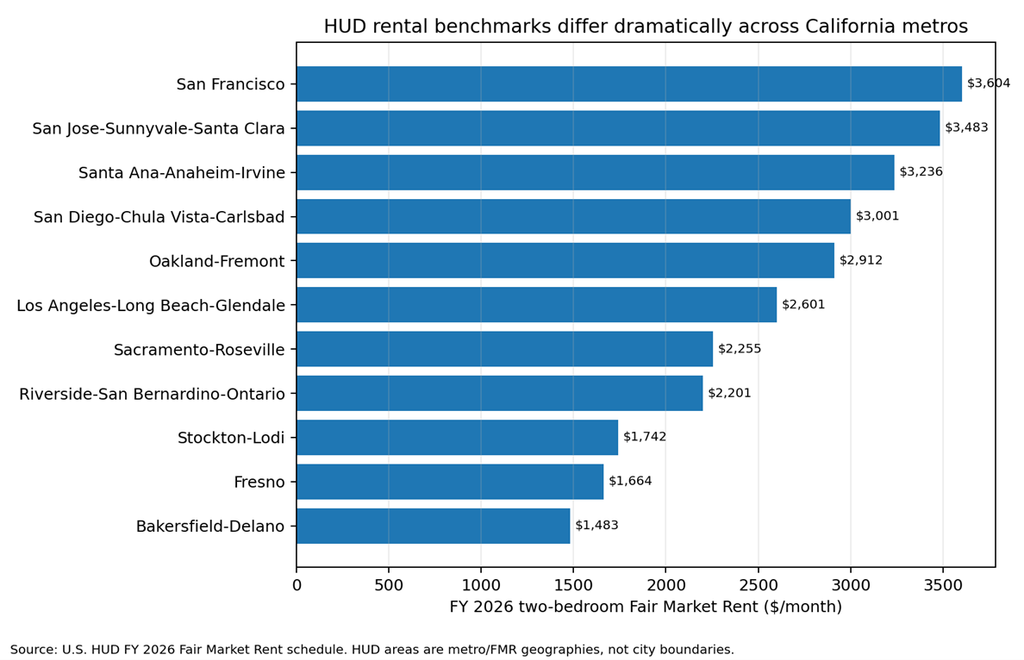
A renter comparing cities should look at three layers rather than one advertised rent:
- Typical local rent: a market or Census benchmark for the city or metro.
- Income-adjusted rent pressure: how annual rent compares with the local median household income.
- Location tradeoff: whether a lower rent creates higher commuting, car or time costs.
Major-City Rent Pressure
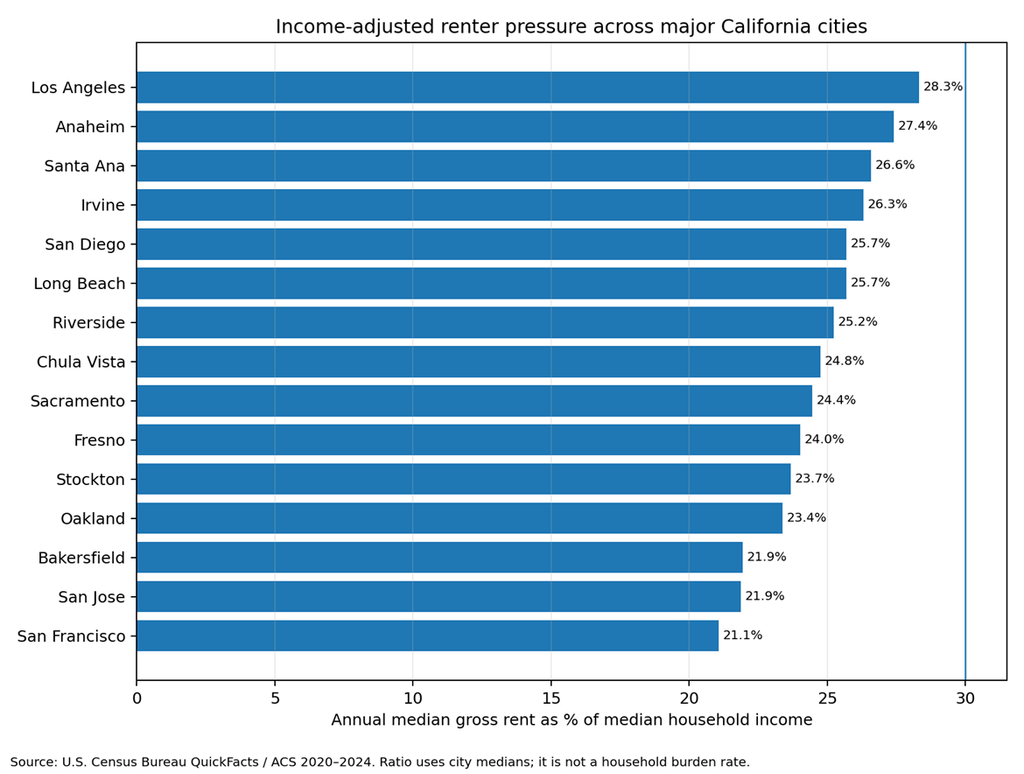
Using Census medians, annual median gross rent ranges from roughly 21% to 28% of median household income across the 15 major cities in this comparison. This is not a household-level rent-burden statistic; it is a City Life Index ratio created from two city medians to support consistent cross-city comparison.
Buying a Home in California
The ownership hurdle is larger than the renter hurdle in many parts of the state. C.A.R.’s recent affordability index estimates that only 19% of California households could afford the statewide median-priced existing single-family home under its assumptions. The same analysis estimated a qualifying income above $220,000.
The Legislative Analyst’s Office reaches a similar practical conclusion from a different angle: for a representative two-bedroom home, its estimated monthly ownership cost was about $4,600, compared with roughly $2,700 to rent. That gap will not apply to every property or household, but it explains why renting can remain rational even for households that eventually want to own.
Major-City Ownership Pressure
The most useful comparison is not home value alone but home value relative to local income. In this 15-city set, Bakersfield is around 4.6 times median household income, while Los Angeles is above 11 times. Fresno, Stockton, Sacramento and Riverside also sit below the coastal high-cost cities on this measure.
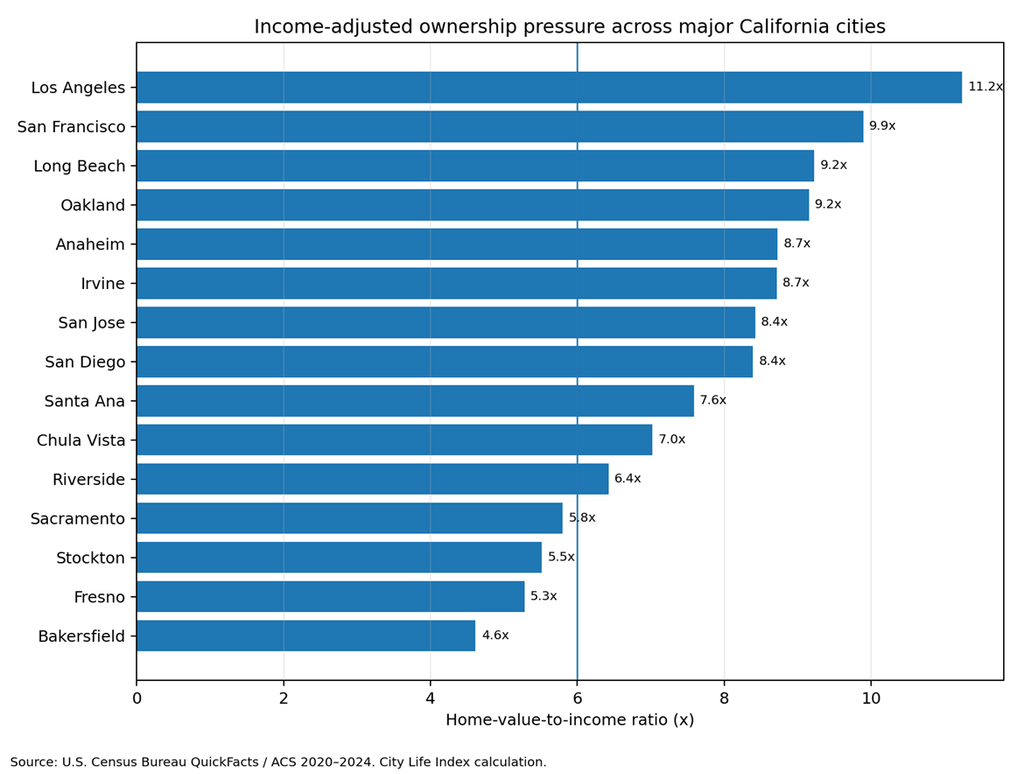
| City | Median income | Median rent | Median home value | Rent / income | Home / income |
| Bakersfield | $80,540 | $1,472 | $371,700 | 21.9% | 4.6x |
| Fresno | $70,991 | $1,421 | $374,800 | 24.0% | 5.3x |
| Stockton | $79,907 | $1,577 | $440,900 | 23.7% | 5.5x |
| Sacramento | $87,321 | $1,779 | $506,300 | 24.4% | 5.8x |
| Riverside | $91,045 | $1,914 | $584,800 | 25.2% | 6.4x |
| Chula Vista | $108,032 | $2,229 | $758,700 | 24.8% | 7.0x |
| Santa Ana | $93,999 | $2,082 | $713,000 | 26.6% | 7.6x |
| San Diego | $108,077 | $2,313 | $906,700 | 25.7% | 8.4x |
| San Jose | $146,427 | $2,669 | $1,233,200 | 21.9% | 8.4x |
| Irvine | $136,719 | $2,997 | $1,191,500 | 26.3% | 8.7x |
| Anaheim | $95,227 | $2,175 | $831,200 | 27.4% | 8.7x |
| Oakland | $101,600 | $1,979 | $929,900 | 23.4% | 9.2x |
| Long Beach | $87,430 | $1,871 | $806,600 | 25.7% | 9.2x |
| San Francisco | $140,970 | $2,476 | $1,394,500 | 21.1% | 9.9x |
| Los Angeles | $81,939 | $1,933 | $921,200 | 28.3% | 11.2x |
What the City Comparison Actually Says
- Bakersfield: lowest ownership pressure in this major-city sample and relatively low rent, but housing is only one part of the relocation decision.
- Fresno and Stockton: lower ownership ratios than the coastal markets; useful starting points for buyers prioritizing price over coastal access.
- Sacramento: a middle-ground ownership option among major California job centers, with a lower home-income ratio than the large coastal cities.
- Riverside: more attainable ownership than Los Angeles, San Diego or Orange County, but commute patterns can materially change the real household budget.
- San Jose and San Francisco: extremely expensive homes in absolute dollars, but high local incomes improve the rent-to-income comparison. That does not make ownership inexpensive.
- Los Angeles, Long Beach, Oakland, Anaheim and Irvine: higher ownership pressure; a renter or buyer should compare neighborhood-level housing and commute costs before using a citywide median.
Rent or Buy? Use a Decision Rule, Not a Slogan
California’s housing market makes blanket advice especially risky. Buying is not automatically the financially superior choice, and renting is not automatically wasted money. The right decision depends on your expected time horizon, down payment, mortgage rate, maintenance costs, taxes, mobility needs and the gap between local rent and ownership cost.
- Lean toward renting when you expect to move again within a few years, the local ownership premium is large, or you need flexibility.
- Consider buying when your income and reserves can comfortably absorb the full monthly cost, you expect to stay long enough to spread transaction costs, and the property fits your life rather than only your investment expectations.
- Run both scenarios using the same neighborhood and housing type. Comparing a downtown apartment rent with a suburban single-family mortgage is not an apples-to-apples decision.
Who California Housing May Fit Best
- High-income professionals: especially those whose income keeps pace with Bay Area or coastal housing costs.
- Remote or location-flexible households: inland cities may offer more space and lower ownership pressure if job location is portable.
- Long-term renters: California’s large rental markets offer broad choice, but metro-to-metro rent differences are substantial.
- Equity-rich movers: existing homeowners with significant equity may face a very different affordability equation from first-time buyers.
Who May Find the Housing Tradeoff Harder
- First-time buyers with modest down payments: high prices and financing costs make the entry hurdle difficult.
- Households tied to high-cost job centers: moving farther out may reduce housing costs but raise commuting time and transportation expenses.
- Buyers stretching to qualify: the statewide affordability data suggests that a large share of households cannot comfortably support the median single-family purchase under standard assumptions.
A Practical California Housing Decision Framework
| If your priority is… | Start with… | Then check… |
| Lower ownership pressure | Bakersfield, Fresno, Stockton, Sacramento | Jobs, neighborhood fit, commute, climate |
| Large coastal job markets | San Diego, San Jose, Los Angeles, San Francisco | Rent-vs-buy gap, neighborhood price, commute |
| Orange County access | Anaheim, Santa Ana, Irvine | Rent vs ownership premium and household income |
| More space for a portable-income household | Inland or Central Valley cities | Heat, transportation, healthcare, airport access |
| Renting before committing | Any shortlist city | HUD FMR + local listings + neighborhood-level lease costs |
Bottom Line
California housing is expensive, but the state is too large and too varied for one number to guide a move. The most useful approach is to separate absolute housing cost from income-adjusted affordability, then compare the same housing type across the cities on your shortlist.
For ownership, inland cities such as Bakersfield, Fresno, Stockton and Sacramento provide a lower entry ratio than the major coastal markets in this comparison. For renters, high-income cities can look less strained on an income-adjusted basis even when sticker prices are very high. The right city is the one where the housing cost leaves enough room for the rest of the life you want to build.
Disclaimer: Statistics and cost figures in this article are estimates compiled from reliable and credible public, government, institutional, and industry sources. Values may vary by source, geography, methodology, property type and market conditions. Modeled City Life Index ratios are calculations from sourced medians and are not official government affordability measures.